AI/ML Model Operations
The Inference Stack: Routing and Serving Layers for LLMs in Production

What sits between your user's request and the GPU — and why it matters for cost and performance
Introduction
Running a large language model in production is not just about picking the right GPU. Between the user's request and the GPU that generates the response, there are multiple software layers — each with a distinct job. Understanding these layers is critical for anyone building or operating AI inference infrastructure.
This post breaks down the two primary layers: the routing layer (how requests get to the right place) and the serving layer (how inference happens). We'll cover the major tools in each category, how they interact, and what you should care about when running vLLM at scale.
At the highest level:
Serving layer — the software that loads the model, runs inference on the GPU, and returns tokens
Routing layer — the software that decides which serving instance handles each request
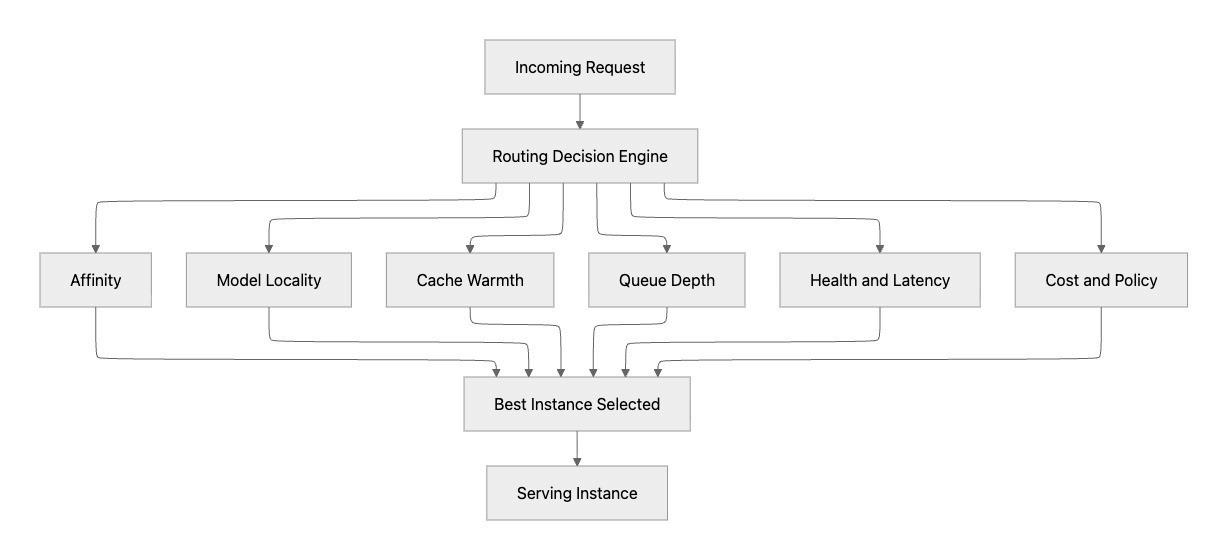
The following diagram shows the online execution path for a single inference request. The routing layer first selects the best serving instance, then the serving runtime performs model execution steps such as model state access, cache use, and batching before running inference on the GPU. The output tokens are streamed back as the user response. The key point is that routing decides placement, while serving performs GPU execution.

The following diagram demonstrates the routing decision logic. It shows how modern routing is a placement decision engine, not simple round-robin load balancing. For each request, routing evaluates multiple signals such as affinity, model locality, cache warmth, queue depth, health/latency, and policy constraints, then selects the best instance. This improves both user-facing performance and fleet efficiency by matching each request to the most suitable serving target.
The Serving Layer
The serving layer is closest to the GPU. Its job is to:
Load model weights into VRAM
Batch incoming requests efficiently
Execute the forward pass on the GPU
Stream tokens back to the caller
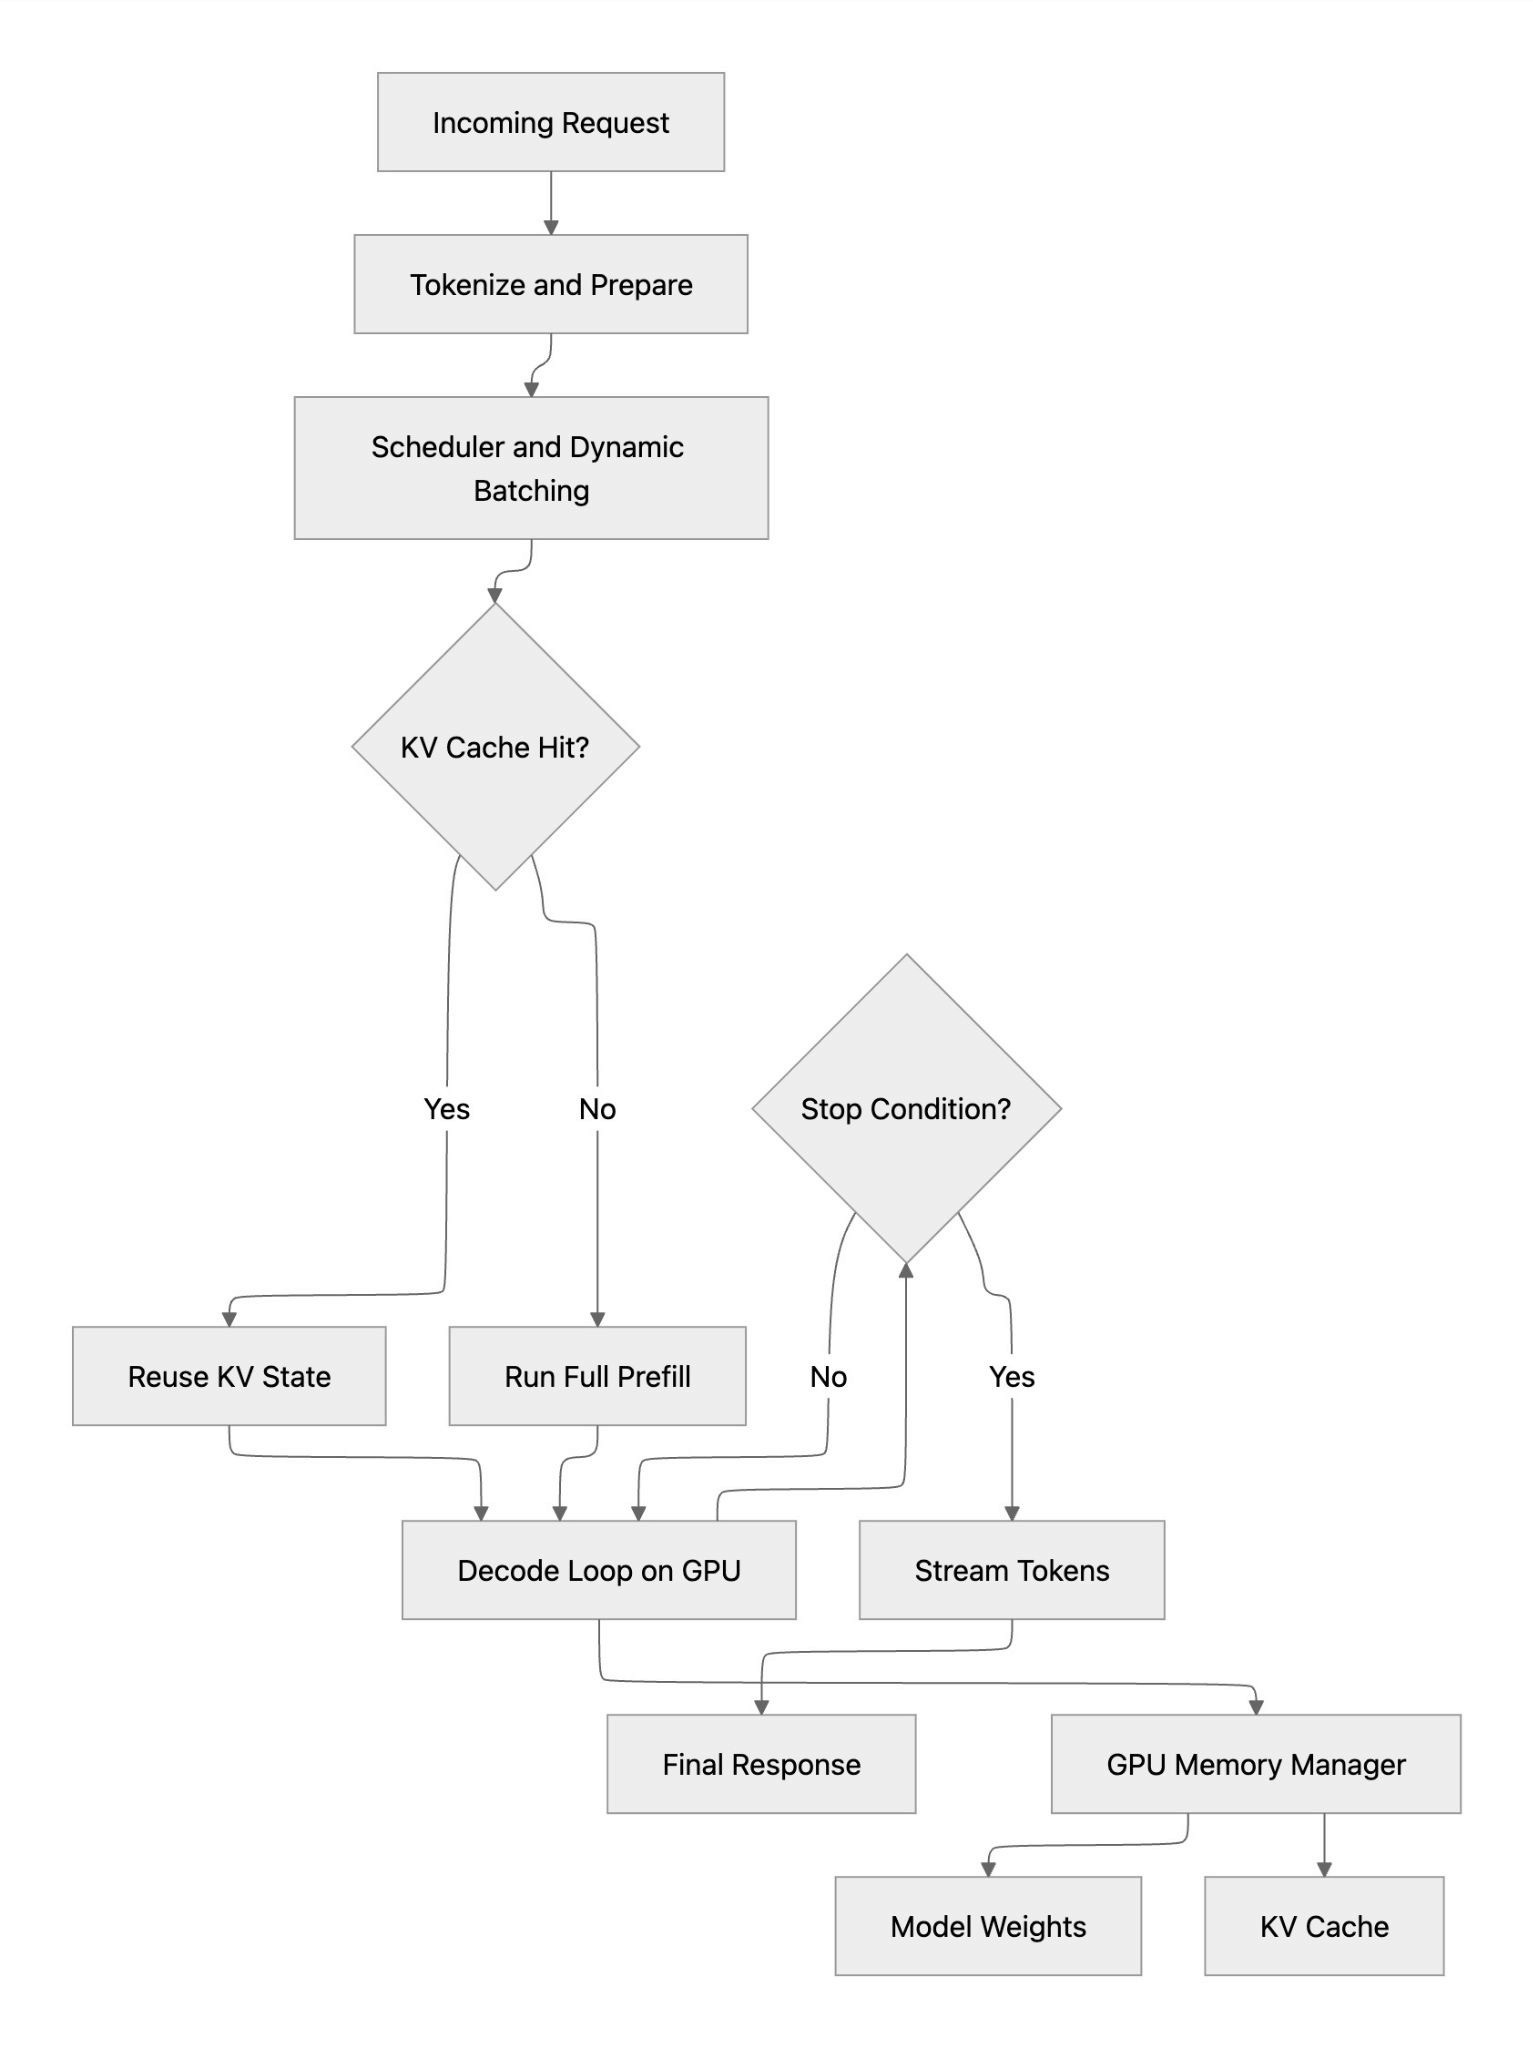
The following diagram shows the serving-layer execution path for a single inference request. After tokenization and batching, the runtime checks whether a reusable KV cache state exists: on a cache hit, it can bypass most prefill work and move quickly into decode; on a cache miss, it must run full prefill before decoding tokens on GPU. Both paths converge at the decode loop, which continues until a stop condition is met and tokens are streamed back to the user. The key takeaway is that serving performance is driven by batching efficiency, cache hit rate, and GPU memory management, all inside the serving layer itself.
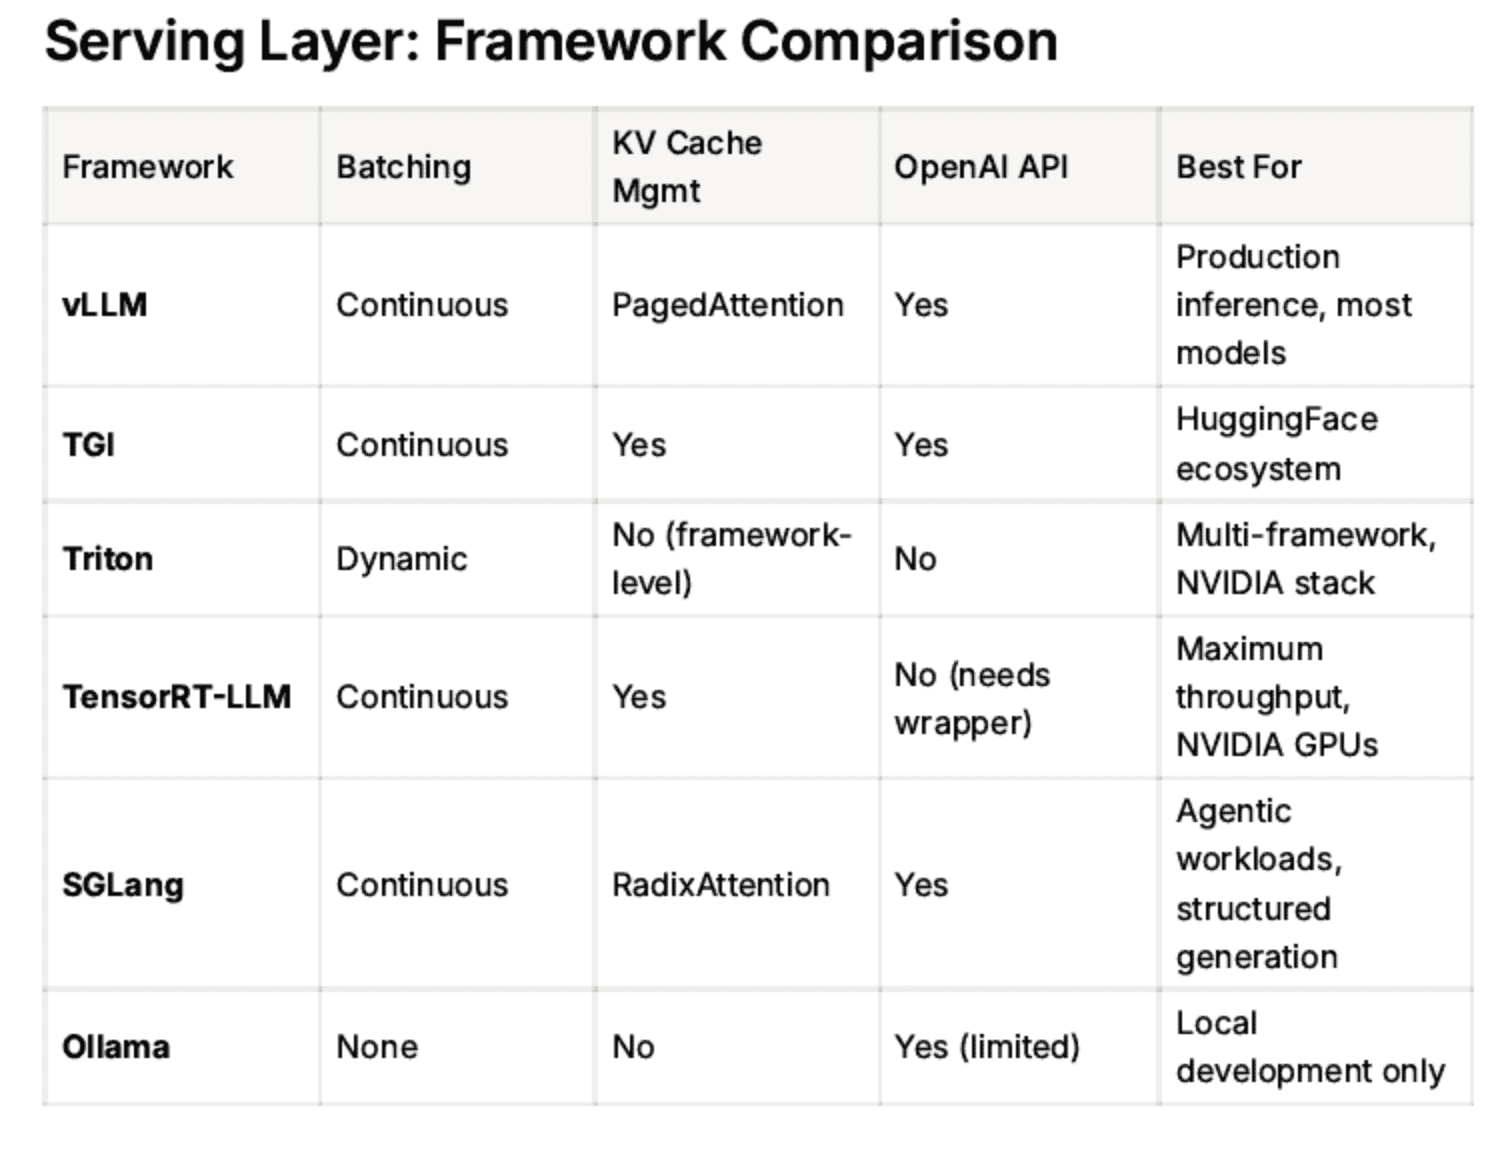
vLLM
vLLM is the most widely adopted open source inference engine. Key innovations are:
PagedAttention — manages KV cache memory like virtual memory in an OS, dramatically reducing waste
Continuous batching — processes requests as they arrive rather than waiting for a fixed batch, maximizing GPU utilization
OpenAI-compatible API — drop-in replacement for OpenAI endpoints
vLLM exposes a Prometheus /metrics endpoint with rich telemetry: tokens per second, KV cache utilization, time to first token, queue depth.
TGI (Text Generation Inference)
HuggingFace's serving framework. Similar capabilities to vLLM, tightly integrated with the HuggingFace model hub. Popular in organizations already using the HF ecosystem.
Triton Inference Server
NVIDIA's general-purpose model server. Supports multiple frameworks (PyTorch, TensorFlow, ONNX, TensorRT). More complex to configure than vLLM but highly flexible for heterogeneous model types.
TensorRT-LLM
NVIDIA's optimized inference engine. Compiles models into highly optimized GPU kernels. Maximum raw throughput — but requires compilation ahead of time and is less flexible for rapid model iteration.
SGLang
A newer serving framework focused on structured generation and multi-call LLM programs. Strong performance on agentic workloads where the model is called multiple times in sequence.
Ollama
Developer-friendly, runs locally on a laptop. Not production-grade — no batching, no metrics, no horizontal scaling. Good for local development only.
The Routing Layer
As you scale from one vLLM instance to many, you need something to decide which instance handles each request. This is the routing layer. There are three sub-layers within routing, from least to most intelligent:
L4: Kubernetes Service (Round Robin)
Every Kubernetes deployment gets a Service by default. It load-balances TCP connections across all healthy pod replicas using round-robin. Zero configuration, always present.
The problem: It has no idea what's happening inside the pods. It doesn't know one pod has a 90% full KV cache and another is idle. It just takes turns.
L7: Ingress / API Gateway
HTTP-aware routing. Can route requests based on URL path, headers, or model name. Examples: nginx Ingress, Istio, Kong, Envoy.
/v1/mistral → mistral-7b pods
/v1/llama → llama-70b pods
/v1/embeddings → embedding pods
Still not inference-aware — it routes by rules, not by pod state.
Inference-Aware Routers
These routers understand the internal state of vLLM pods by polling their /metrics endpoints. They can make smarter decisions:
LiteLLM Proxy
Sits in front of multiple model endpoints (vLLM, OpenAI, Anthropic, Bedrock)
Handles failover, retries, API key management
Routes based on queue depth and availability
Model-agnostic — works with any OpenAI-compatible backend
vLLM Router (built-in)
Same vLLM binary, run in router mode (no model loaded)
Routes based on KV cache affinity — if a request shares a prefix with a previous request, route to the pod that already has that prefix cached
Dramatic TTFT reduction for repeated system prompts
Best for homogeneous vLLM fleets
NVIDIA Dynamo
Disaggregated serving — separates the prefill phase (processing the prompt) from the decode phase (generating tokens) into different pods
Prefill is compute-intensive, decode is memory-bandwidth-intensive
Routing ensures the right type of pod handles each phase
Maximum throughput at scale
llm-d (IBM/Red Hat)
Kubernetes-native distributed inference platform
KV cache aware routing
Built on top of vLLM
Open source, CNCF-aligned
Why KV Cache Affinity Matters
This deserves a deeper explanation because it's the key insight behind inference-aware routing.
When vLLM processes a request, it computes and stores the Key-Value cache for every token in the prompt. If the next request has the same system prompt (which is common in production — every API call to the same assistant shares the same system prompt), vLLM can reuse the cached computation instead of recomputing it.
Without KV cache affinity routing:
Request 1 goes to Pod A → computes KV cache for the 500-token system prompt
Request 2 goes to Pod B (round-robin) → recomputes the same 500-token KV cache from scratch
Wasted compute, higher TTFT, lower throughput
With KV cache affinity routing:
Request 1 goes to Pod A → computes and caches
Request 2 goes to Pod A → cache hit, skips prefill entirely
Lower TTFT, higher throughput, same GPU cost
The router knows which pod has which prefixes cached by reading vllm: prefix_cache_hits_total from the /metrics endpoint.
When a request shares context with a previous one — a system prompt, a multi-turn history, a long document — routing it to the same serving instance means the KV state from the first request is already in GPU memory. With round-robin routing, that doesn't happen: each pod independently recomputes the same prefill from scratch, adding hundreds of milliseconds before the first token. With affinity routing, the second request lands on the same pod and reuses the cached KV state, skipping most of the prefill work entirely. The difference is visible in time-to-first-token: a cold prefill on a 2K-token system prompt might cost 548ms; with a cache hit on the same pod, that drops to ~50ms. The model did no less work overall — the KV state still had to be computed once — but affinity routing ensures that work is only done once.
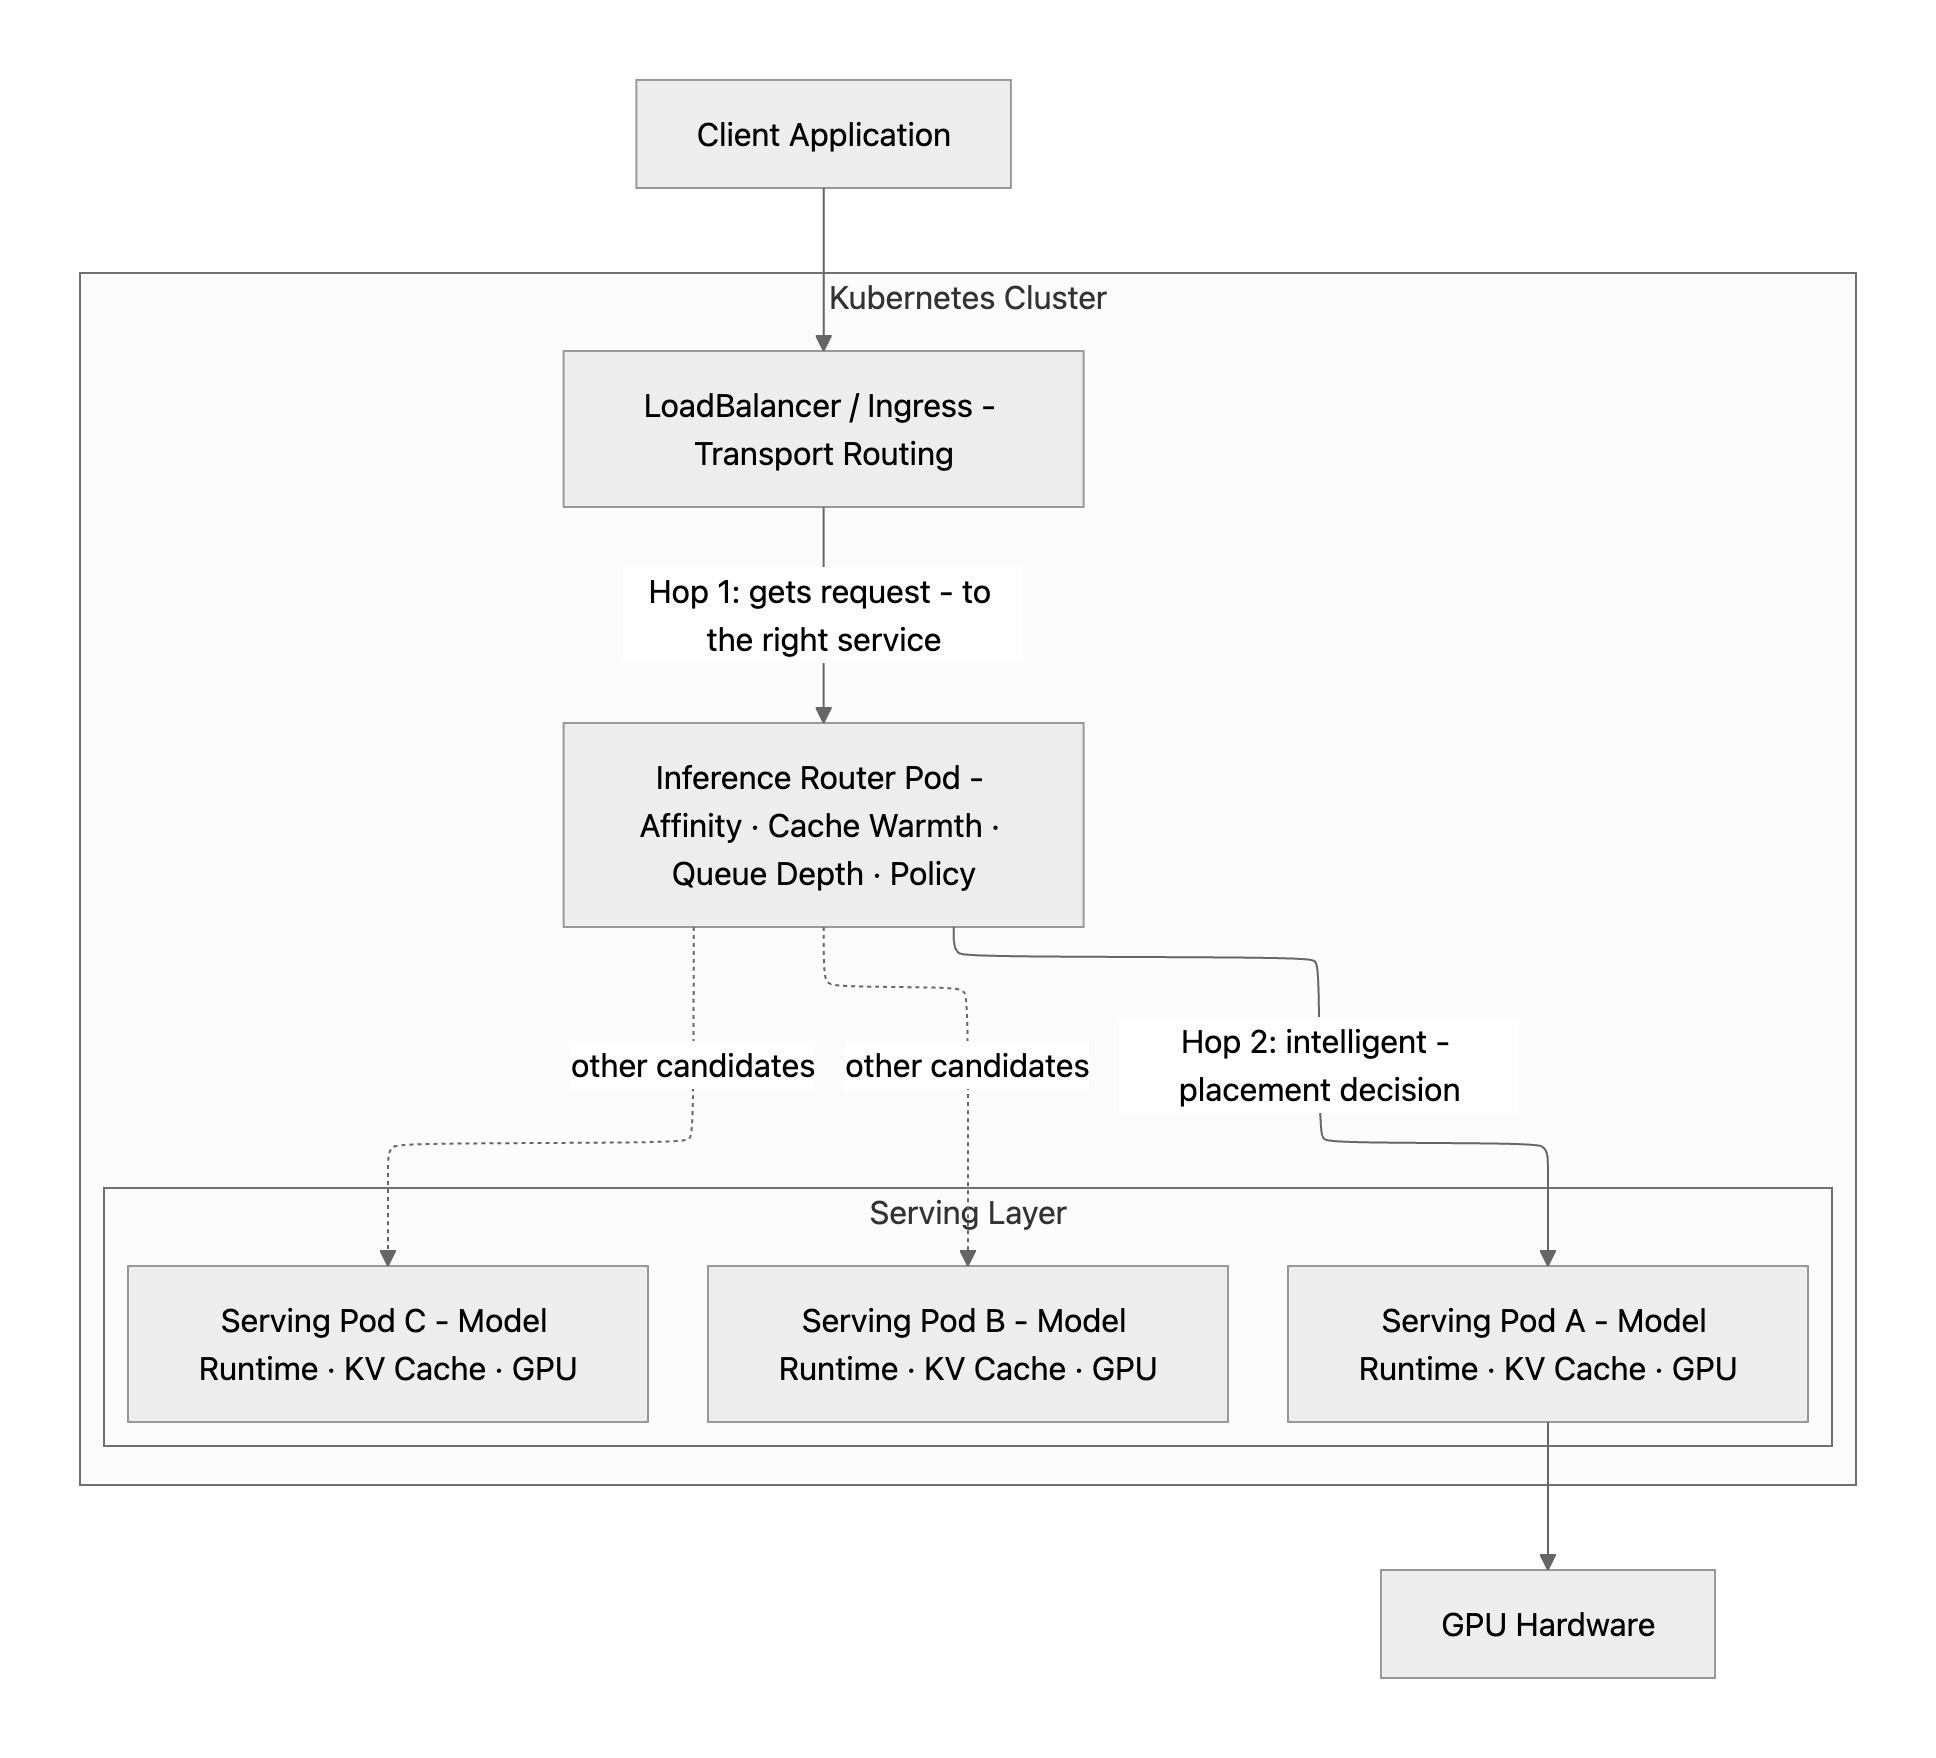
The Full Stack
Every inference request travels two distinct hops inside the cluster. Kubernetes handles the first: a LoadBalancer or Ingress takes the request and delivers it to the inference router pod — standard transport, no intelligence. The router handles the second: it evaluates affinity, cache warmth, queue depth, health, and cost policy, then forwards directly to a specific serving pod, bypassing Kubernetes' default round-robin entirely. Inside that pod, the serving layer takes over — batching the request, checking for a KV cache hit, running prefill or reusing cached state, and executing the decode loop on GPU. The stack has a clear division of responsibility: Kubernetes moves bytes reliably, the router places work intelligently, and the serving layer executes it efficiently.
What This Means for Observability
Each layer generates signals that matter for understanding fleet health:
Layer | Key Signals |
vLLM (serving) | TTFT, tokens/sec, KV cache %, queue depth, MFU |
K8s Service | Pod health, replica count |
Inference Router | Cache hit rate, per-pod queue depth, routing decisions |
API Gateway | Request rate, error rate, latency by model |
The problem today is that these signals live in different places — Prometheus, Kubernetes API, gateway logs — with no unified view across the fleet. This is exactly the gap that tools like piqc address: a single read-only scan that surfaces the serving layer signals (GPU utilization, throughput, cost efficiency, tier fit) across all deployments in your cluster — in two commands, in seconds.
Summary
Layer | Tool Examples | Intelligence Level |
Serving | vLLM, TGI, Triton, TensorRT-LLM | High — manages GPU, batching, KV cache |
Inference Router | LiteLLM, vLLM Router, Dynamo | High — KV cache affinity, queue-aware |
L7 Gateway | nginx, Istio, Kong | Medium — HTTP/path routing |
L4 Service | Kubernetes Service | Low — round-robin only |
Start simple (K8s Service + vLLM). Add layers as you scale. Know which layer to add and when. If you're running vLLM in production and want to see what your fleet actually looks like — GPU utilization, cost efficiency, tier fit — try piqc. Two commands, read-only, no agents.