GPU fleet efficiency and reliability for AI teams

Find the productive capacity already inside your GPU fleet.
Recover it before you buy more.

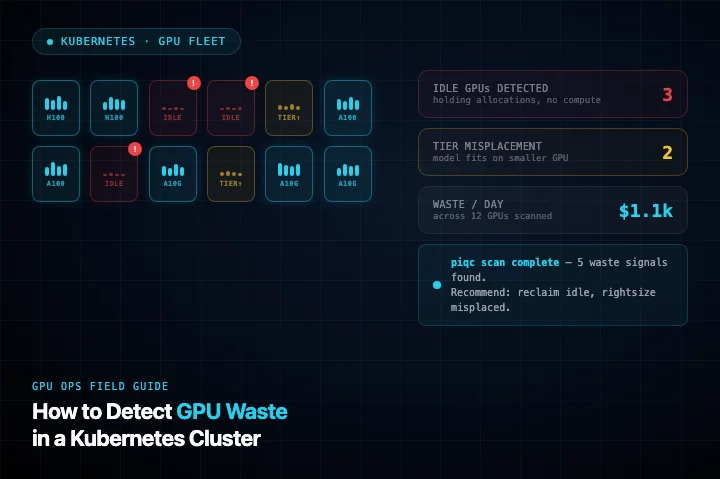
Idle GPUs, mis-tiered models, and hidden inefficiency inflate your cost per token and hide the risk signals that turn into incidents. We target recovering 20–40% of the waste without touching production.

Paralleliq finds the waste and risk, recommends the fix, and keeps your team in control of every change, with a full audit trail and nothing executed without human approval.

Your model weights, inference data, and customer traffic never leave your environment. Only operational metrics flow to the platform, evaluated through a deterministic rules engine, not a black-box model. Optional AI-assist is the only thing that ever reaches beyond it. It doesn't optimize utilization at the expense of performance.

paralleliq.app / fleet
 live
Workload infer-prod-eu running at 81% utilization · KV cache healthy
2s ago
Incident · KV cache pressure on a100-pool-2
needs approval
Tokens/sec
0
GPU util
0%
KV hit rate
0%
+ recommend rebalance shard 3 → 5 (a100-pool-2)
- evict idle replica infer-canary-2 · saves $184/hr
~ scale tier from B → A for prompt-7b
audit chain · sig 0x9f2…ae1
fleet utilization+12.4%
cost / 1k tokens−7.1%
Watch how Paralleliq works

One fleet. Five questions.

01

Where is the money going?

Connects GPU utilization and workload behavior directly to AI COGS and gross margin, not just a utilization percentage.

02

What's our unit economics, GPU by GPU?

The marginal cost of inference at the deployment and workload level: idle capacity, tier mismatch, and other spend you can recover without changing what you build.

03

Do we really need more GPUs?

How much productive capacity remains in your existing fleet before the next CapEx cycle.

04

Where is the fleet leaving capacity on the table?

Capacity sitting on fixed spend that isn’t converting to variable output, found without touching anything on its own.

05

What exactly should we change, and is it safe?

The one your dashboards can't answer. The specific change for each workload (GPU tier, replicas, configuration) with its dollar impact, the evidence behind it, and your team's approval before anything moves.

What you get isn't another chart

A decision, not just a dashboard

Every finding arrives as a specific change your team can approve, with the evidence, the dollars, and the manifest to apply it. The fleet dashboards show where it all adds up.

Illustrative example
Waste · GPU tier mismatchConfidence: high

llama-3-8b-instruct is on an H100 it doesn't need

The model's weights and KV cache fit comfortably on an L4, and GPU utilization has stayed low for 7 days while latency runs well inside target, so the headroom the H100 buys isn't being used.

Current
3 × H100 80GB
Recommended
3 × L4 24GB
p95 latency today
410 ms (target 800 ms)
Est. savings
≈ $5,000 / month
Approve changeDecline with reasonReady-to-apply manifest included
A recommendation

The blind spot every dashboard shares, except this one

These failure modes are invisible to infrastructure monitoring because catching them requires understanding the model, not just the machine underneath it.

GPU tier fit changes as models and traffic evolve.

Models get updated. Traffic patterns shift. Token compression changes context length. The tier that was correctly sized six months ago may not match the workload running on it today, and nothing in standard monitoring will tell you until throughput drops or the bill arrives.

Why Paralleliq catches this: We read the model, not just the machine. GPU tier recommendations are matched to the actual model and workload shape, so tier misplacement gets flagged as it happens, not discovered on the bill.


0xA13Fevictscaledrainwarnschedtierkv:hitshardrps0xA13Fevictscaledrainwarnschedtierkv:hitshardrps0xA13Fevictscaledrainwarnschedtierkv:hitshardrps0xA13Fevictscaledrainwarnschedtierkv:hitshardrps0xA13Fevictscaledrainwarnschedtierkv:hitshardrps0xA13Fevictscaledrainwarnschedtierkv:hitshardrps0xA13Fevictscaledrainwarnschedtierkv:hitshardrps0xA13Fevictscaledrainwarnschedtierkv:hitshardrps0xA13Fevictscaledrainwarnschedtierkv:hitshardrps0xA13Fevictscaledrainwarnschedtierkv:hit

You're buying GPUs you don't need yet.

When utilization looks high, the instinct is to order more hardware. But high utilization is often a false signal: GPUs can be busy without being productive, and the meter runs while the real capacity picture stays unclear.

Why Paralleliq catches this: Utilization alone can't tell the difference between busy and productive. We look underneath it (batch size, instance type, concurrency) so you know your real capacity runway before you place a 12-week-lead-time order.

By the time your monitoring catches it, your customer already has.

A customer deploys a model slightly too large for their chosen GPU tier. Under load, KV cache pressure builds and the container crashes. Your platform gets the support ticket, even though the root cause was a configuration the customer created. Without model-aware intelligence, there is no way to catch this before it happens.

Why Paralleliq catches this: Where Paralleliq is going: catching this takes understanding the model on each GPU, not just CPU/memory graphs, which is exactly what Paralleliq reads. KV-cache pressure and OOM early warning, built on that model-level view, is in development.

IQ

How Paralleliq delivers it

More productive capacity from the GPUs you already have, without trading away performance. The engine is rules-based and deterministic, and nothing touches your cluster without your team's approval.

Start read-only, with no changes to your stack

A one-time read-only scan first, then a lightweight agent reading the metrics your stack already exposes. Collection is moving to a standard OpenTelemetry Collector. vLLM, KServe and Ray Serve workloads are discovered automatically.

Know your real $/token

What each deployment costs per hour and per token, priced to your contracted rates and model catalog, and where tier mismatches, dark capacity or idle replicas inflate it.

Get the exact fix, not another alert

Every finding names the specific change, what it's worth and the evidence behind it, including risk findings such as GPU hardware faults and over-privileged service accounts. KV-cache and OOM early warning is in development.

Your team approves every change

Every recommendation is approved by a person and every action is logged permanently. No black-box automation touches production.

Data boundary you can explain

Model weights, inference data and customer traffic never leave your environment; only operational metrics reach the platform. Optional AI assist sends finding summaries to Claude. It is configurable, and off by default for environments that need zero third-party data flow.

Fits the tools you already run

Pull every finding through the API into your ticketing, dashboards or FinOps tools.

Built for teams where GPU cost is a business problem

The same recoverable capacity means something different depending on how you're structured around GPU cost. Here's what it means for teams like yours.

Enterprise AI Teams

Do more AI with the same budget. Never get caught in a procurement emergency.

You run your own models on your own infrastructure. Recovering utilization waste stretches your AI budget further and tells you your hardware ordering deadline months in advance, before the capacity crunch, not during it.

GPU Cloud Providers

Give your customers lower $/token, without cutting your margins.

You own GPU hardware and rent capacity to customers. Part of what you already have isn't working as hard as it could, and we target recovering 20–40% of that waste. Every point of recovered utilization is a customer you can onboard today, without a procurement cycle.

Hosted Model API Providers

$/token is your pricing page. Own it.

You host open-source models and charge per token, so every GPU inefficiency hits your P&L directly, with no customer buffer. Recovering 20–40% of your fleet's wasted capacity, our target, is how you onboard the customers already evaluating alternatives.

Inference Deployment Platforms

Catch failures before your customers do.

You host your customers' models, on your cloud or theirs. Every OOM event and cold start is a customer weighing whether to stay on your platform; catching those before they happen protects retention without expanding infrastructure.

Compatible with your stack

Built on open standards: reads the Prometheus metrics your stack already exposes, and is moving to a standard OpenTelemetry Collector.

Reads signal from

vLLMvLLM Production StackRay ServeKServe

Runs on

KubernetesOpenShift (being validated)

Find out what your GPUs can already do.

Request Demo